Project Cost Analyzer
Master Your Construction Budget with a Project Cost Analyzer
Managing a construction project is no small feat, especially when it comes to keeping finances in check. Whether you’re a project manager overseeing a high-rise or a contractor handling a home renovation, tracking expenses across different stages is crucial. That’s where a robust tool for analyzing project expenses comes in handy, offering clarity on where every dollar goes.
Why Tracking Costs Matters
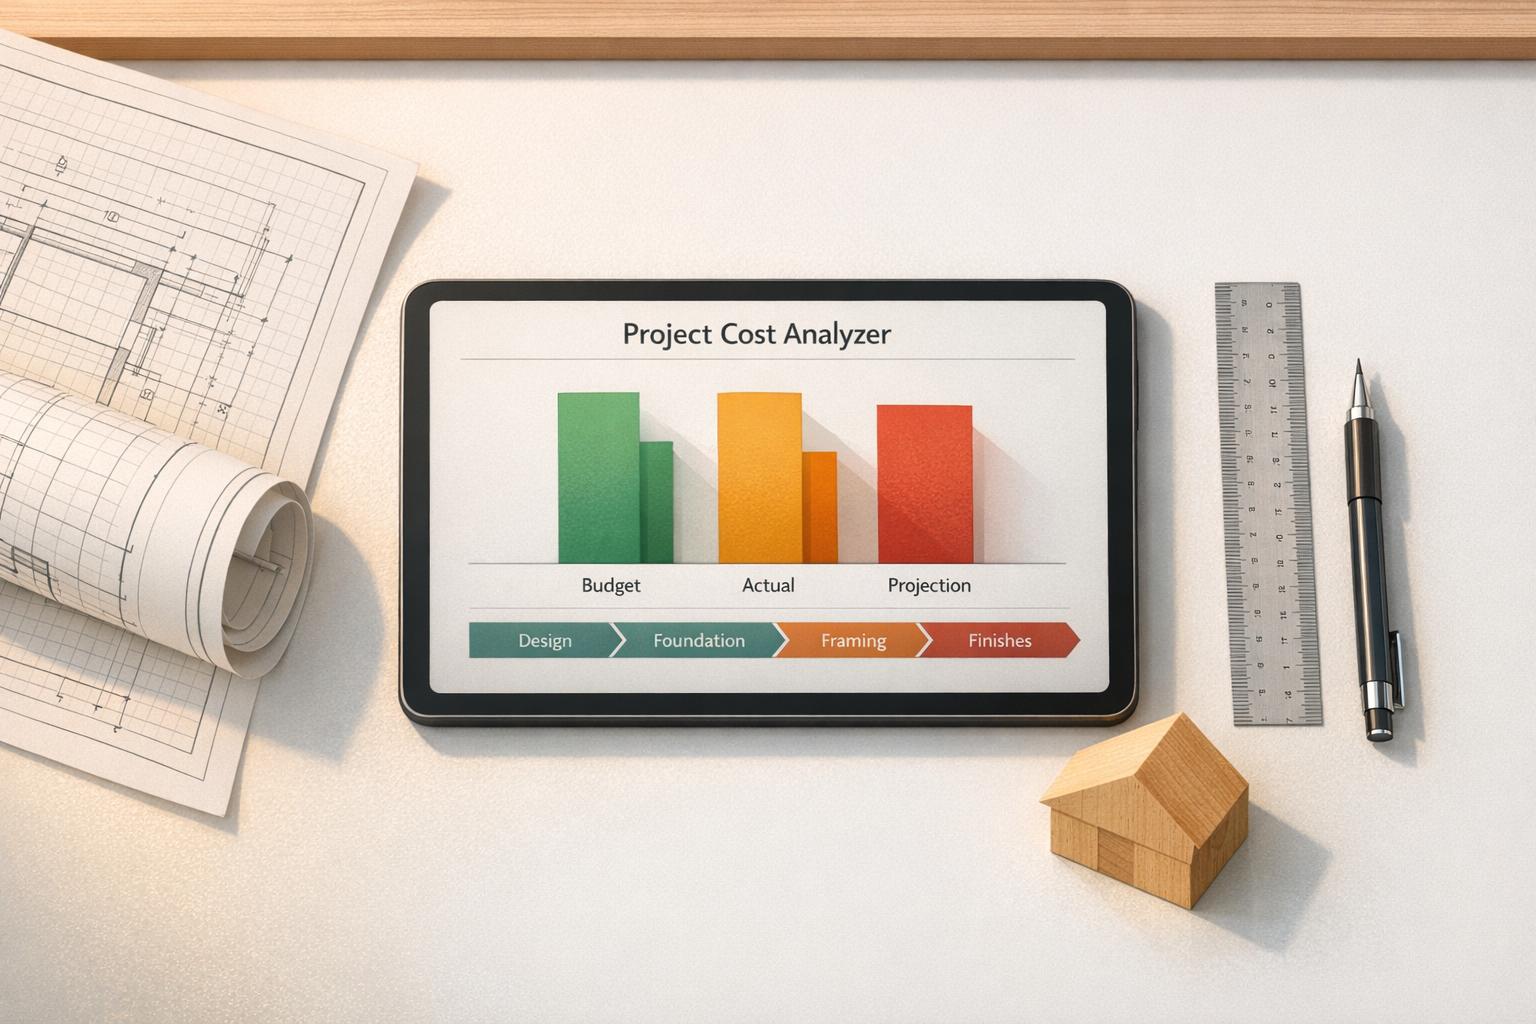
Construction projects often span multiple phases—planning, foundation, framing, and finishing, to name a few. Without a clear view of spending at each step, it’s easy to lose track and face unexpected shortfalls. A dedicated budget analysis tool empowers you to input data for each phase, compare planned versus actual costs, and visualize the distribution of funds. You’ll instantly see if certain areas are eating up more resources than expected and get projections to plan ahead. Beyond numbers, this kind of insight helps with decision-making, ensuring you can pivot strategies before costs spiral. For anyone in the building industry, having a handle on finances isn’t just helpful—it’s essential for delivering projects on time and within scope.
FAQs
How does this tool help with budget overruns?
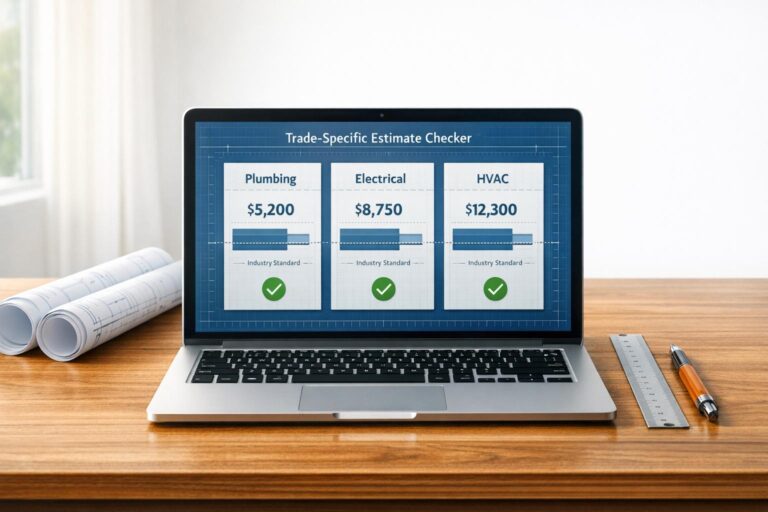
Great question! Our Project Cost Analyzer breaks down costs by phase and compares planned versus actual spending. If you’re over budget in, say, the foundation phase, it flags that with a clear note like ‘5% over budget’ and even suggests potential areas to cut costs. This way, you can adjust on the fly before small overruns turn into big problems. It’s like having a financial advisor right in your browser.
Can I update my data as the project progresses?
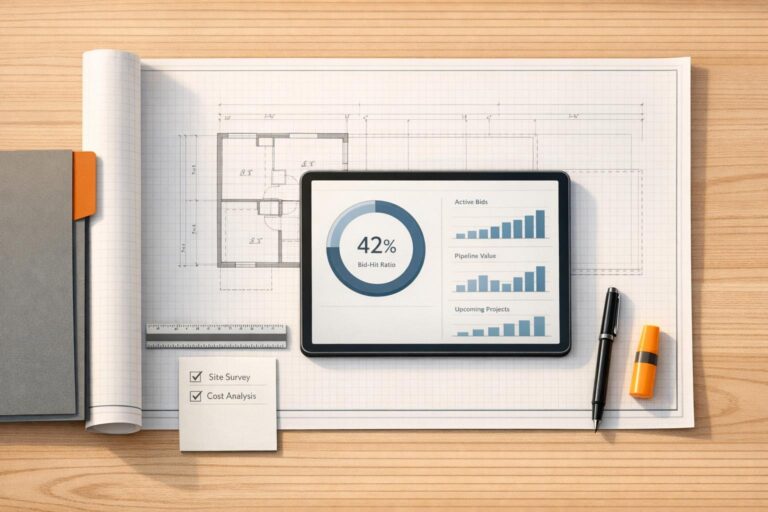
Absolutely, that’s one of the best features! You can tweak your budget, add new phases, or update costs anytime. Hit refresh, and the tool recalculates everything—charts, projections, and budget status—instantly. It’s built to keep up with the real-time changes that happen on construction projects, so you’re always working with the latest numbers.
What kind of output does the tool provide?
You’ll get a clean, visual summary that’s easy to digest. Think bar charts or tables showing costs per phase, how much of the total budget each takes up as a percentage, and whether you’re over or under budget. Plus, there’s a total cost overview and a projection of what’s left to spend based on your current pace. If there are overruns, we toss in a quick note on where you might save some cash.