
How Location Affects Labor Cost Estimates

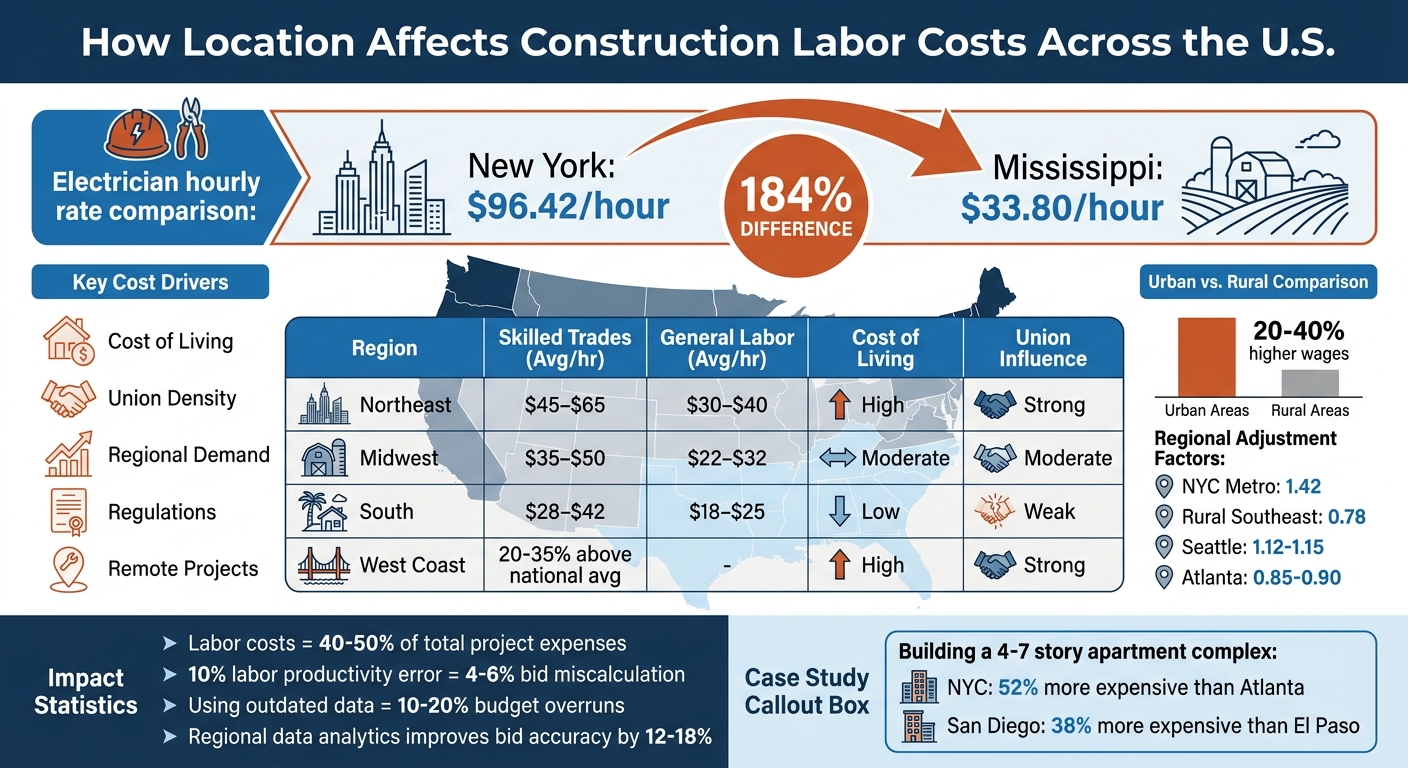
Labor costs in construction vary widely by location, impacting project budgets and profitability. For example, an electrician in New York might cost $96.42/hour, while in Mississippi, the same work could cost $33.80/hour – a 184% difference. These variations stem from factors like:
- Cost of living: Higher wages are needed in expensive cities (e.g., NYC or San Francisco).
- Union density: Unionized areas (Northeast, West Coast) drive up wages compared to non-union regions.
- Regional demand: Fast-growing areas like Texas or Colorado see wage spikes due to labor shortages.
- Regulations: Stricter local codes and safety laws (e.g., California’s Title 24) increase costs.
- Remote projects: Travel, lodging, and productivity losses add expenses in rural or isolated areas.
Even a 10% error in labor productivity assumptions can lead to a 4–6% bid miscalculation, potentially costing hundreds of thousands on large projects. Accurate estimates require up-to-date, region-specific labor data and tools like ScopeTakeoff, which automates local adjustments and reduces guesswork. Ignoring these factors risks unprofitable bids and project losses.
Regional Construction Labor Cost Differences Across U.S. States and Regions
How to Estimate Construction Labor Costs – (Complete Guide)
sbb-itb-4ee4ad4
The Problem: Location-Based Labor Cost Estimation Challenges
Getting labor costs right is no easy task, especially when local factors can drastically alter expenses. The same trade, crew size, and project scope can cost wildly different amounts depending on the location. Subcontractors often have to adjust their pricing strategies for each region they work in. Understanding the key drivers behind these location-based cost differences is crucial for accurate bids. Using trade-specific estimating software can help automate these adjustments across different regions.
Cost of Living and Wage Differences
Local cost of living plays a big role in determining wage expectations. Housing costs, in particular, heavily influence wages. For instance, a skilled electrician in New York City might earn between $70 and $85 per hour due to the high cost of living, while the same job in Kansas City may pay only $40 to $48 per hour.
Labor costs typically make up 40% to 50% of a project’s total expenses. Higher wages are often necessary in expensive metropolitan areas to attract skilled workers. In the Northeast, skilled trades earn an average of $45 to $65 per hour, while in the South, rates drop to $28 to $42 per hour.
Using outdated or generalized data can lead to budget overruns of 10% to 20%. On a $50 million project, this could mean an extra $5 to $10 million in unexpected costs. Regional variations are stark: the West Coast, for example, often sees costs that are 20% to 35% higher than national averages, while the Northeast typically carries a 15% to 25% premium. High-density urban areas further complicate matters with added costs for specialized labor and stricter safety requirements.
| Region | Skilled Trades (Avg/hr) | General Labor (Avg/hr) | Cost of Living | Union Influence |
|---|---|---|---|---|
| Northeast | $45–$65 | $30–$40 | High | Strong |
| Midwest | $35–$50 | $22–$32 | Moderate | Moderate |
| South | $28–$42 | $18–$25 | Low | Weak |
Labor Availability and Regional Demand
Fast-growing areas can create unpredictable wage fluctuations. Regions like the Sunbelt (Texas, Florida, Georgia) and Mountain States (Colorado, Utah) are experiencing rapid population and industrial growth, which can lead to noticeable shifts in labor rates within months. Labor shortages in these areas often force subcontractors to make tough choices.
When skilled workers aren’t available locally, subcontractors may need to hire less experienced labor or rely on apprentices. This can reduce productivity by 10% to 20%. Urban centers like New York and Chicago typically offer higher wages to meet labor demand, while rural areas may have lower wages but face challenges like a lack of specialized skills, leading to higher mobilization costs. Remote projects often see productivity drops of 5% to 15%, thanks to longer material transport distances and limited local labor pools. Additionally, sustained overtime (60+ hour weeks) can cause a 15% to 25% productivity decline after the third week.
Union Influence and Regional Wage Agreements
Union contracts add another layer of complexity to labor cost estimation. Union wage rates are set by contracts, not market conditions, tying wages to specific roles rather than individual worker skills. This creates a "burdened" rate that includes base wages plus benefits like pensions, health insurance, and training funds.
Unionized trades often drive up costs. In cities like New York, Boston, and Philadelphia, union wages contribute to higher-than-average labor costs. Studies show union membership creates a wage premium of 10% to 15% in both the U.S. and UK. Even in non-union areas, strong union presence can push employers to raise wages to avoid unionization, complicating estimates further.
Government projects add yet another challenge. The Davis-Bacon Act requires minimum pay rates tied to local union standards, meaning estimators must track wage determinations by county and trade classification. Union agreements also come with extra administrative demands, such as certified payroll reporting and strict apprentice-to-journeyman ratios, which can inflate bid costs.
"If you bid jobs using $30 [base wage], you’re losing $12.45 for every hour that person works."
Additional Costs for Remote Projects
Remote projects come with unique challenges. When local skilled labor isn’t available, subcontractors often need to bring in workers from other regions, which adds costs for travel, lodging, and per diem allowances. Combined with productivity losses of 5% to 15% due to longer transport distances and limited local resources, these factors can quickly turn a profitable bid into a financial strain.
Factors That Drive Location-Based Labor Costs
Understanding what influences labor costs is critical for subcontractors aiming to create accurate bids. Three main factors shape these costs: state wage laws, local codes and regulations, and demand for skilled workers. Each plays a unique role, but together, they explain the significant cost differences subcontractors encounter. Let’s dive into how local regulations impact labor costs.
State and Regional Wage Differences
Wage disparities across states and regions are largely shaped by local economies and labor laws. As of April 2025, the national average hourly wage in construction stood at $39.30, but this figure masks significant state-level variations. For instance, construction workers in Alaska and Massachusetts earn over $50 per hour on average, while those in Arkansas make just $29.30 per hour.
In Southern states, Right-to-Work laws limit union influence, enabling more flexible wage negotiations and lower baseline costs. In contrast, the Northeast and West Coast have higher union density, which drives up wages through collective bargaining agreements. Nevada, experiencing a construction surge, recorded the fastest wage growth in the U.S. at 10.6% in mid-2025. Similarly, Mississippi saw a 10% increase due to industrial expansion, while Oklahoma faced a 3.0% wage decline following market contraction.
Urban areas also tend to pay significantly more than rural regions, with wages in cities averaging 20% to 40% higher. This difference stems from the need to attract skilled labor for complex projects in high-density areas. For example, construction costs in San Diego, California, are up to 38% higher than those in El Paso, Texas, mainly due to labor and regulatory factors. Specialized concrete estimating software can help account for these regional variations in material and labor costs. Similarly, building a mid-rise apartment in New York City costs 52% more than in Atlanta, Georgia. For complex builds, using masonry estimating software ensures that local labor rates for brick and block work are accurately reflected in the bid. These wage variations are just one piece of the puzzle, with regulations and market demand further complicating the landscape.
Regulatory and Code Requirements
Local building codes and safety regulations significantly influence labor costs by adding compliance expenses and reducing productivity. States like California and New York enforce strict energy-efficiency, green building (e.g., LEED, Title 24), and safety standards, which increase project costs. Compliance with these codes can raise total project costs by 5% to 20%.
Regional risks also play a role. Earthquake-resistant designs in California, hurricane-proof structures in Florida, and snow load considerations in Colorado all require specialized labor and longer timelines. Permitting delays add another layer of complexity, with medium-sized commercial projects experiencing 3 to 6 weeks of delay, while larger developments face waits of 3 to 6 months. These delays extend project timelines and inflate overhead costs.
In high-regulation areas, stricter safety and quality standards can reduce hourly labor productivity, requiring estimators to adjust man-hour projections. For example, total construction costs in San Diego can be 38% higher than in El Paso, driven by labor laws and earthquake-resistant building codes.
"In construction estimating, permits and regulations are more than bureaucratic hurdles – they are fundamental cost drivers that can make or break a bid." – Profound Estimates
Local codes and safety requirements, alongside wage laws, are key factors shaping labor costs.
Market Demand for Skilled Trades
When construction activity surges in certain regions, competition for skilled workers intensifies, driving up wages and subcontractor fees. In these booming areas, contractors must compete for a limited pool of skilled labor. For example, in 2026, the West Coast saw the largest average wage increase in the U.S. at 5.8%, fueled by tight labor markets in California, Washington, and Oregon.
Regional labor markets can shift rapidly due to factors like population growth, industrial expansion (e.g., data centers), and large-scale infrastructure projects. These changes can alter local labor rates within months. In 2026, the wage gap between the highest-cost state (New York) and the lowest-cost state (Mississippi) for the same trade reached 184%. Additionally, metro-area prevailing wages are, on average, 38% higher than rural rates within the same state.
Using outdated or generalized cost data instead of localized figures can lead to budget overruns of 10% to 20%. In contrast, leveraging regional data analytics and hyperlocal estimating improves bid accuracy by 12% to 18%.
"Without regionally specific cost data, you’re not estimating – you’re guessing." – RSMeans
Regional Labor Cost Comparisons
The following examples highlight how labor costs differ across U.S. regions. Recognizing these variations helps subcontractors fine-tune their estimates based on the project location.
Urban vs. Rural Labor Costs
Labor costs in urban areas are significantly higher than in rural ones. Major cities like New York City or Chicago often pay 20% to 40% more for skilled labor compared to smaller towns. Regional adjustment factors range from 0.78 in the rural Southeast to 1.42 in the New York City metro area. For instance, completing a project in NYC could cost 82% more than doing the same work in a rural Southern area, with labor being the main factor driving this gap.
In 2025, skilled trade workers in New York City earned between $70 and $85 per hour, while in Dallas, rates were notably lower at $45 to $55 per hour. Similarly, the rural Midwest shows a cost factor of 0.82, underscoring how much less expensive labor is in non-metropolitan markets. Beyond urban and rural divides, coastal and inland areas also show distinct cost patterns.
Coastal vs. Inland Regions
Labor costs in coastal regions are typically higher due to union influence, stricter regulations, and elevated living costs. The Northeast and West Coast are at the top of the price scale, with construction labor in the Northeast costing 15% to 25% more than the national average. On the West Coast, costs are 20% to 35% above average, driven by regulations like California’s Title 24 and seismic building requirements.
In contrast, labor costs in inland cities are generally lower. For example, Seattle has a local cost factor ranging from 1.12 to 1.15, Denver falls between 0.95 and 1.12, and Atlanta ranges from 0.85 to 0.90. Chicago sits in the middle with a factor of 1.17 to 1.22. These differences often result from lower union presence and less regulatory oversight in inland areas. Subcontractors can use these benchmarks to refine their bids and achieve more precise labor cost estimates.
Case Study: Apartment Complex Costs
To illustrate these regional disparities, consider a case study from March 2025. Gordian (RSMeans Data) analyzed the costs of building a four-to-seven-story apartment complex. Their findings revealed that constructing in New York City costs 52% more than in Atlanta, largely due to higher union wages and urban congestion. Similarly, building in San Diego, California, can increase total project costs by up to 38% compared to El Paso, Texas. This is attributed to California’s elevated labor rates, strict environmental regulations, and earthquake-resistant construction requirements. For context, San Francisco has a local cost factor of 1.30, while El Paso’s is 0.86 – representing a 44-point difference in relative costs.
"A project that fits within budget in one state could break the bank in another. Labor rates, material costs, climate conditions and local regulations all shape project expenses." – RSMeans
These examples highlight the importance of tailoring labor cost estimates to the specific location of each project for better accuracy and budgeting.
Solutions: How to Improve Location-Based Labor Estimates
Subcontractors can tackle location-based cost challenges by focusing on three key strategies: leveraging accurate regional data, building tailored cost libraries, and keeping rates up to date. These approaches directly address the complexities of location-based pricing and help ensure bids are both competitive and profitable.
Using Regional Labor Rate Data
The most reliable way to adjust estimates for different locations is by applying regional cost index multipliers to your base estimates. The formula is simple:
Adjusted Estimate = Base Cost × (Regional Index ÷ 100).
For instance, if your base project estimate is $100,000 and you’re bidding in Seattle, where the regional factor is 1.15, the adjusted estimate would be $115,000.
But relying solely on base wages can lead to inaccuracies. To avoid this, calculate "fully burdened" or "loaded" rates that include payroll taxes, workers’ compensation, health insurance, retirement contributions, and paid time off. These additional costs can range from 35% to 55% of base wages.
"A $30/hour carpenter actually costs you $42.45/hour. If you bid jobs using $30, you’re losing $12.45 for every hour that person works." – Projul
Beyond wages, adjust productivity rates based on factors like crew skill, site logistics, weather, project complexity, building height, and supervision quality. For example, multi-story projects often require adding 2% to 5% more labor-hours per floor above ground level due to material handling and transport challenges. For government-funded projects, Davis-Bacon or state-specific prevailing wage requirements may apply, overriding standard market rates.
Building Regional Cost Libraries
While accurate rate data is essential, having customized cost libraries tailored to specific regions can make your estimates even sharper. Relying solely on national averages often falls short. By building your own cost libraries, you can create distinct rates for different trades and experience levels, considering variations in workers’ compensation and productivity rates. For example, rates for a lead carpenter will differ significantly from those for an apprentice.
When calculating hourly costs, use actual productive hours instead of the standard 2,080-hour work year. Productive hours typically range between 1,750 and 1,900 annually, accounting for downtime like holidays, sick days, and training. This ensures your calculations reflect real-world conditions.
To keep estimates accurate, maintain a rolling 12-month average of productivity rates from completed projects. This approach often outperforms published averages. HVAC estimating software with digital time tracking by cost code can further refine your data, helping you identify inefficiencies and update future assumptions.
Keeping Data Current and Accurate
Outdated data can be costly. Using stale or non-localized figures can lead to overruns of 10%–20%, potentially adding millions in unexpected expenses on large projects. With labor wages rising 4.6% annually and material costs increasing by 8.7% per year, even data from two years ago may no longer be reliable.
To stay accurate, review and update wage rates, union agreements, and insurance premiums at least quarterly. In volatile markets or for prevailing wage projects, more frequent updates may be necessary. Supplement your database with real-time quotes from local suppliers and subcontractors to capture temporary market fluctuations that published indices might miss.
Finally, replace paper timesheets with digital time tracking tools. These provide real-time, task-specific data that can feed directly into your cost libraries, ensuring continuous improvement and better-informed estimates.
Using ScopeTakeoff for Location-Based Labor Estimates
Making accurate, location-specific labor estimates becomes much easier with the right tools. ScopeTakeoff addresses regional challenges by providing precise cost libraries tailored to different areas, automating calculations, and generating proposals that comply with local wage requirements. Its Multi-Entity Profiles feature ensures that proposals include the correct local license numbers and addresses, which is especially useful for contractors working across state lines. These features align seamlessly with the regional cost adjustment strategies we’ve covered.
Pre-Built Trade-Specific Assembly Libraries
ScopeTakeoff offers pre-built assembly libraries for over 10 trades, including concrete, masonry, drywall, painting, HVAC, flooring, remodeling, landscaping, roofing, and asphalt. These libraries simplify the estimating process by automatically breaking down labor and material costs as soon as you input quantities. This eliminates the need to manually price each location. Even better, you can customize these assemblies with your own regional labor rates. For example, whether you’re bidding in Birmingham, where labor might cost $28 per hour, or Boston, where it could run $55 per hour, the software adjusts the total estimate accordingly.
"The masonry assembly library alone is worth it. I used to count every block by hand off the plans. Now I enter the dimensions and it automatically provides quantities and material estimates." – Mike C., Masonry Contractor, Birmingham, AL
In addition to these pre-built libraries, the platform fine-tunes estimates using trade-specific conversions for added precision.
Automatic Trade Calculations for Local Adjustments
ScopeTakeoff also automates trade-specific conversions and calculations, helping to minimize manual errors. With Auto Trade Calculations, measurements are converted into trade-specific units – like cubic yards for concrete, board counts for drywall, or tonnage for asphalt. This allows you to apply local labor rates to exact quantities without additional calculations. By doing so, it reduces the likelihood of underestimating materials or labor hours, which can be costly mistakes.
Generating Accurate Proposals with Local Rates
Once you’ve tailored your assemblies to reflect local labor and material costs, ScopeTakeoff makes it easy to generate professional proposals. With just one click, you can create a Schedule of Values (SOV) formatted for general contractor submissions, as well as polished, client-facing proposals. This eliminates the time-consuming task of manual reformatting after completing an estimate. The result? Faster bid preparation and accurate reflection of local wage and regulatory requirements in every proposal.
"Our estimators turn around 3x as many bids per week now. The SOV export goes directly to the general contractor, eliminating reformatting." – Travis W., Roofing Sub, Nashville, TN
At a cost of $100 per user per month – with no annual contracts or setup fees – the platform includes access to all 10+ trade libraries, PDF plan takeoff, and unlimited projects. For subcontractors managing bids across multiple regions, ScopeTakeoff not only slashes bid preparation time but also ensures every proposal accounts for local labor rates, regulatory demands, and labor burdens.
Conclusion
Location isn’t just a minor detail – it’s one of the biggest cost factors in construction estimating. Labor alone makes up 40–60% of total project costs, so overlooking regional wage variations, union rules, local regulations, or even climate-related productivity shifts can derail your bid before the project begins. For example, a simple 10% miscalculation in labor productivity can lead to a 4–6% difference in your overall bid price. That’s the thin line between securing a profitable project and taking a financial hit.
The key to avoiding these pitfalls? Leverage regionally specific data instead of relying on guesswork. Construction firms using advanced estimating tools and local data analytics report bid accuracy improvements of 12–18%. Whether you’re estimating for a high-cost area like New York City (with labor factors around 1.42) or a more affordable rural location (closer to 0.78), the right tools ensure these adjustments are applied consistently and accurately.
ScopeTakeoff simplifies this process by offering pre-built trade-specific assembly libraries and automated regional adjustments. This means you can factor in local labor rates seamlessly – no manual recalculations needed. At just $100 per user per month, with no long-term contracts, it’s a straightforward solution for subcontractors across 10+ trades to create precise, location-adjusted bids in less time.
"Without regionally specific cost data, you’re not estimating – you’re guessing." – RSMeans
Don’t leave your profits up to chance. By integrating local labor rates, regulatory requirements, and climate-driven productivity changes into your estimates, you’ll safeguard your margins, strengthen client trust, and confidently win more bids.
FAQs
What location factors change labor costs the most?
When it comes to labor costs, geography plays a huge role. Three major factors stand out:
- Regional wage differences: Wages can vary significantly from one region to another due to differences in living costs, economic conditions, and labor supply.
- Construction cost indices: These indices reflect the cost of materials, labor, and equipment in specific areas, directly impacting project budgets.
- Local market conditions: Factors like demand for skilled labor, availability of workers, and competition among employers can drive wages up or down.
These elements don’t just affect wages – they also influence benefits and overall project expenses. Paying attention to these variables is crucial for creating accurate labor cost estimates tailored to specific locations.
How do I calculate a fully burdened labor rate?
To figure out a fully burdened labor rate, you begin with the employee’s base hourly wage and then factor in all associated costs. These include payroll taxes, benefits, insurance, and any indirect expenses like equipment or vehicle costs. Here’s how you can break it down:
- Start with the base hourly wage: This is the employee’s standard pay rate.
- Add payroll taxes, benefits, and insurance: Include costs like Social Security, Medicare, health insurance, and retirement contributions.
- Factor in indirect costs: Think about expenses like tools, equipment, or even vehicle usage tied to the employee’s work.
- Add everything together: Combine all these components to arrive at the total hourly cost.
This total gives you a more accurate picture of the true cost of employing someone.
How often should I update regional labor rates?
Regional labor rates need to be reviewed and updated at least every six months. This is because labor costs can shift dramatically based on changes in local economies and market trends. Frequent updates ensure your estimates stay aligned with current conditions, leading to more precise and reliable projections.